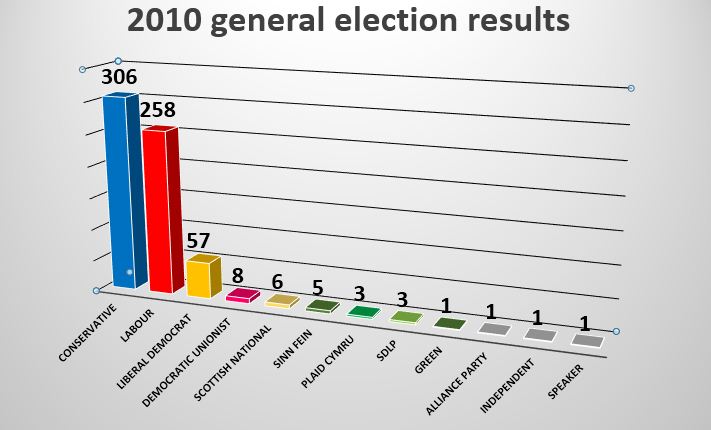
UK election result 2010, UK election result Party wise, United Kingdom Election Results, 2010 UK general election results, 2010 General election results, Party wise UK election result 2010, party scores, electorate, turnout, majority, Total Vote share, to
- Details
- Last Updated: Monday, 13 April 2015 17:32
UK election result 2010, UK election result Party wise, United Kingdom Election Results, 2010 UK general election results, 2010 General election results, Party wise UK election result 2010, party scores, electorate, turnout, majority, Total Vote share, total candidates
|
Party |
Seats |
Votes |
Vote % |
|
Conservative |
306 |
1,07,03,744 |
36.1 |
|
Labour |
258 |
86,06,518 |
29 |
|
Liberal Democrat |
57 |
68,36,198 |
23 |
|
Democratic Unionist |
8 |
1,68,216 |
0.6 |
|
Scottish National |
6 |
4,91,386 |
1.7 |
|
Sinn Fein |
5 |
1,71,942 |
0.6 |
|
Plaid Cymru |
3 |
1,65,394 |
0.6 |
|
SDLP |
3 |
1,10,970 |
0.4 |
|
Green |
1 |
2,84,823 |
1 |
|
Alliance Party |
1 |
42,762 |
0.1 |
|
Independent |
1 |
2,29,021 |
0.8 |
|
Speaker |
1 |
22,860 |
0.1 |


